Overview
Charts harness Swift Charts to visualize data within your prototype. You can customize the type, style, legend, and more. Right now, data is randomized, but in the future, Play will support data import.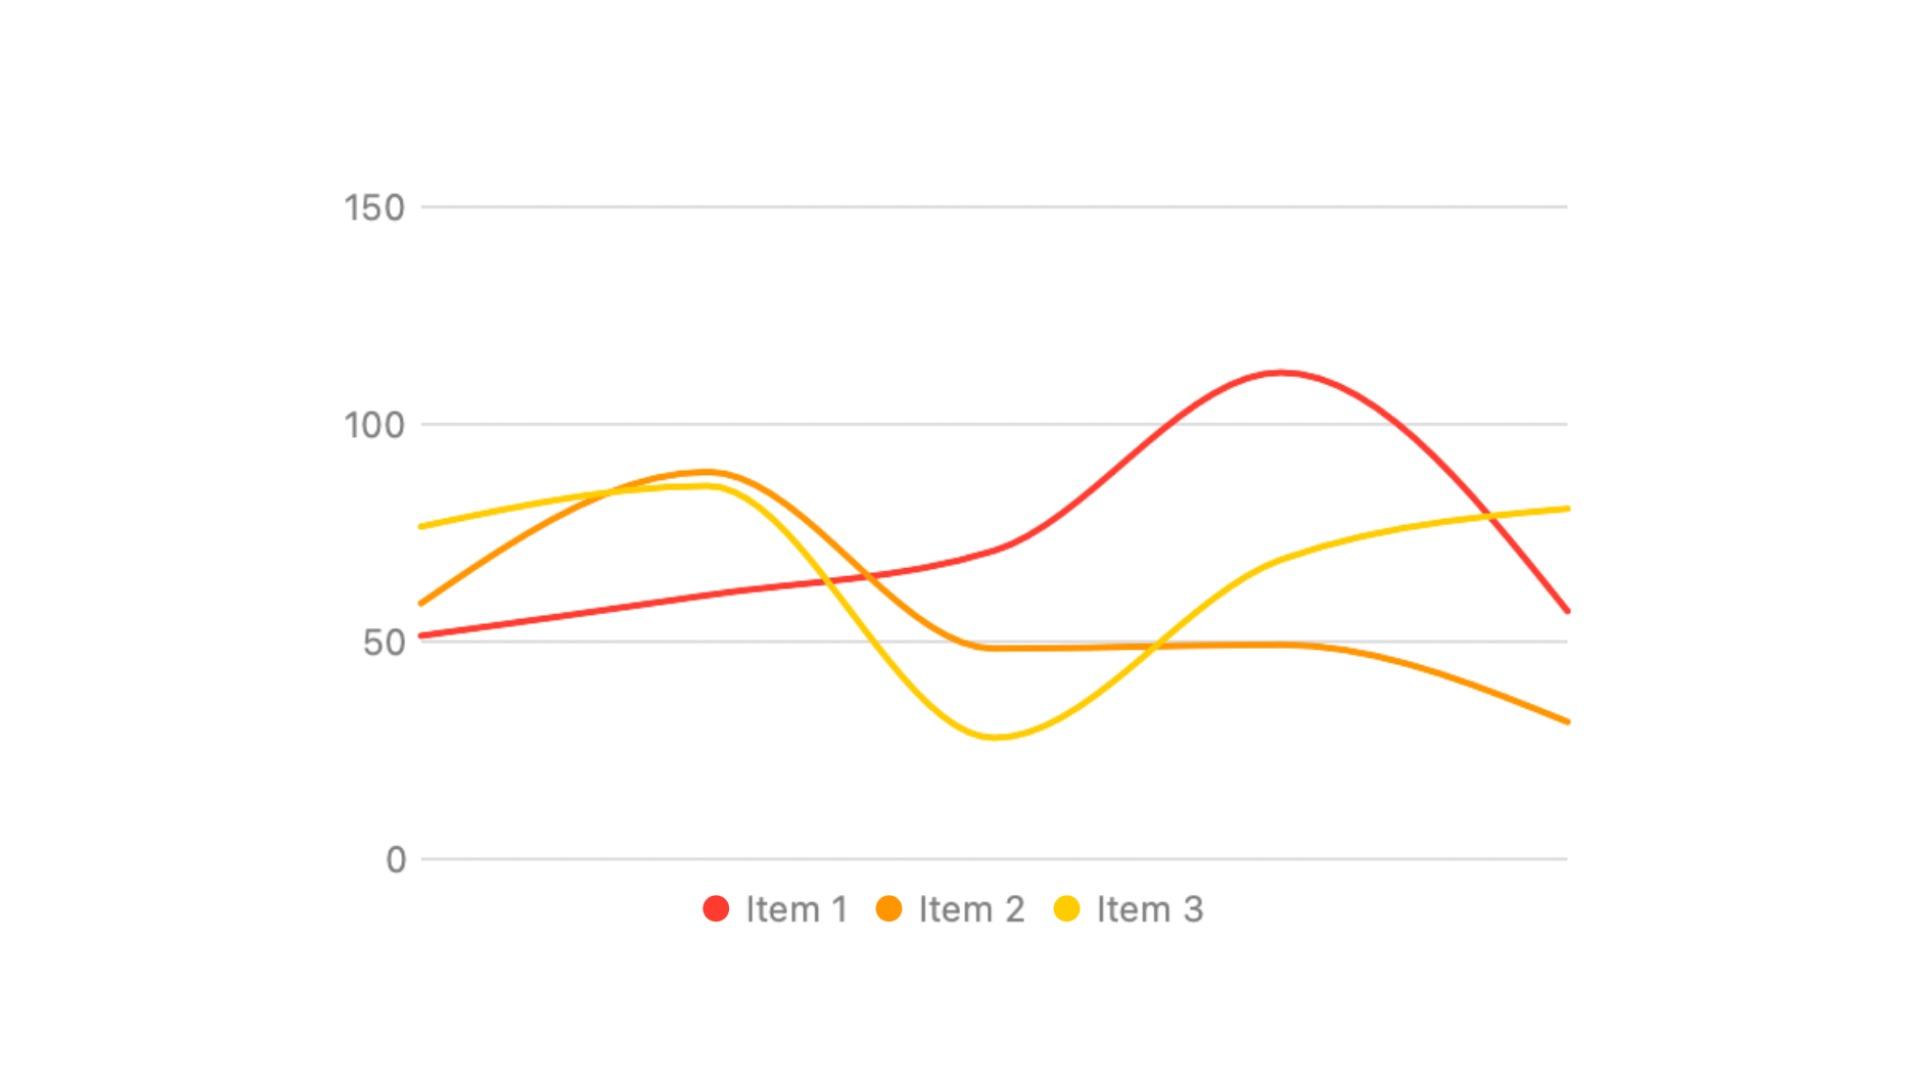
Properties
In addition to the properties below, charts also have access to general object properties in the Expression Editor.
Type
Select the way the data is visualized:- Line: Each data set is visualized by a line.
- Area: Each data set is visualized by a filled area above or beneath a line.
- Plot: Each data set is visualized by a series of dots.
- Bar: Each data set is visualized by a series of vertical bars.
Interpolation
Select the way your line behaves between data points (available for Line and Area charts only):- Monotone: Displays a smooth line by “guessing” the values between data points based on known data points.
- Linear: Connects a straight line between each data point, creating a jagged path. It’s clear to a viewer where the data points are.
- Step: Creates a vertical line in between each data point, connecting one point to the next with a step-like shape.
Shape
Select the shape of the data set to tell a desired story:- Increasing: Displays improving or rising values over the X-axis.
- Decreasing: Displays decreasing values over the X-axis.
- Steady: Displays consistent values over the X-axis.
- Random: Displays random values over the X-axis.
Count
Choose the number of data points for each series (2-100).Noise
Set the variability in the data. A lower noise value makes the data more similar; a higher noise value makes the data vary more.Series
Set the number of series in the chart (1-5). Each series is a different data set, displayed as a different line, bar, dot, or area.Stacking
Choose how the series are stacked (available for Bar and Area charts only):- Default: Displays the series without stacking.
- Centered: Displays the series stacked vertically in the middle of the chart.
- 100%: Displays the series stacked to fill 100% of the vertical space by making the area/height proportional.
- Overlapping: Displays the series stacked on top of each other.